- Published on
Being Productive with DevTools
75% of a developer's time is spent on debugging, which amounts to approximately 1500 hours a year.
This means we all debug our code and applications and spend quite a huge amount of time on that. This can be reduced by several methods and ways and one of them is to avoid navigating back and forth between the browser and code editor and using Chrome (or your favorite browser) DevTools.
This blog covers some of the DevTools feature that can help you debug your applications.
Debugging Tips
Following are some of the ways to not only debug your code but also speed up your development in general. Some of the following tips are about general productivity that can boost your development process.
Command Palette
I have to start with this time - search feature is always extremely helpful. In case you don't know, DevTools also have search option, similar to VS code, where you can search for commands, panels and drawers, quick setting options etc. To open the command palette, you can use CTRL/CMD + SHIFT + P which will open a search bar with list of options.
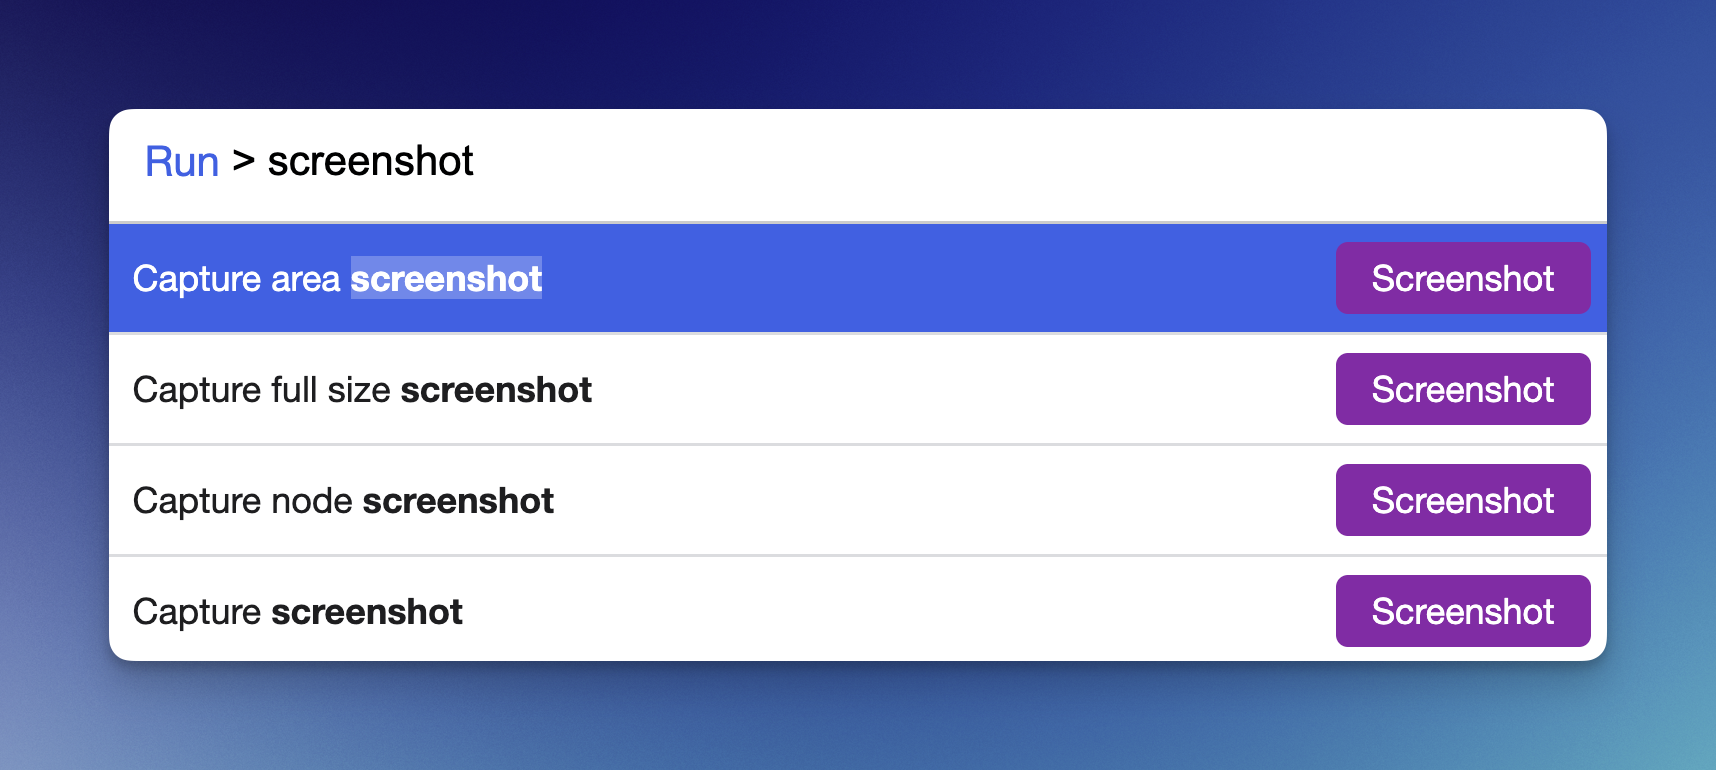
Here's how to capture high quality screenshots using command palette in DevTools.
Breakpoints
Breakpoints are crucial when debugging applications and going step-by-step each line. For frontend applications, you can use breakpoints in the DevTools to monitor the JavaScript code.
To add a breakpoint in your code, you can click on the line number which adds a blue ribbon. This is similar to the red dot in VS Code.
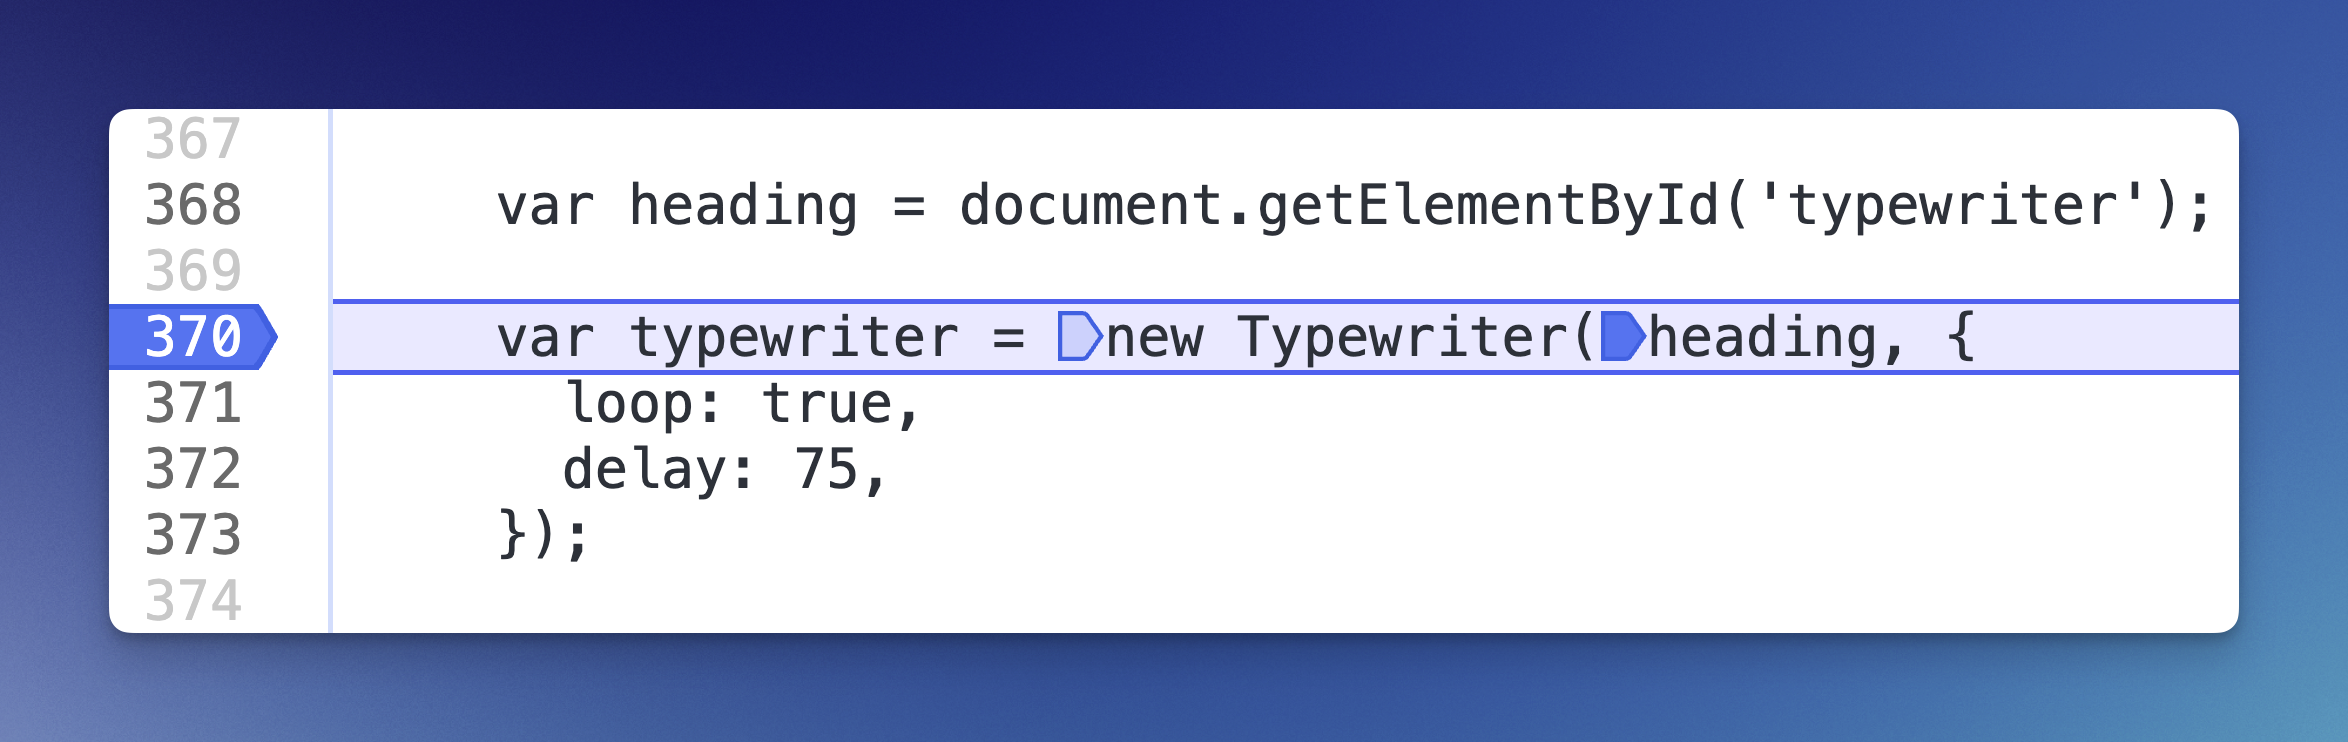
This is a simple breakpoint and your code execution will be paused when reached to this point.
Conditional Breakpoint
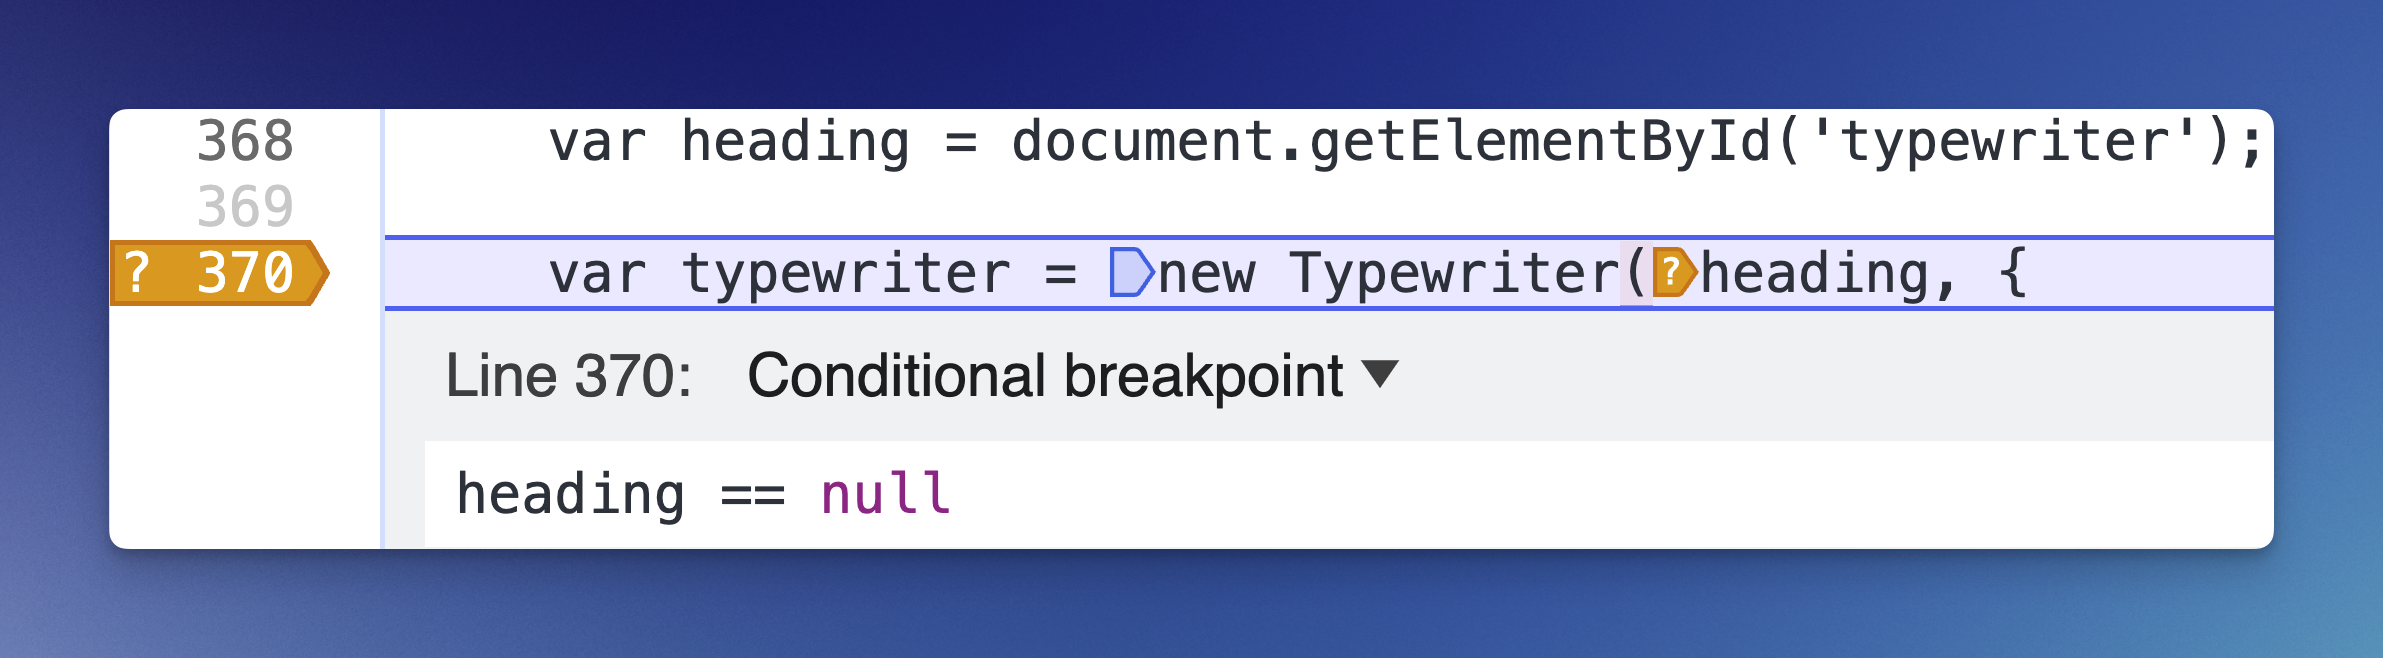
Suppose you want to pause the code on a specific condition, let's say when a variable is null (heading == null). You can do so by right clicking the blue ribbon > Edit it > Make it a conditional breakpoint and add the condition.
Log point
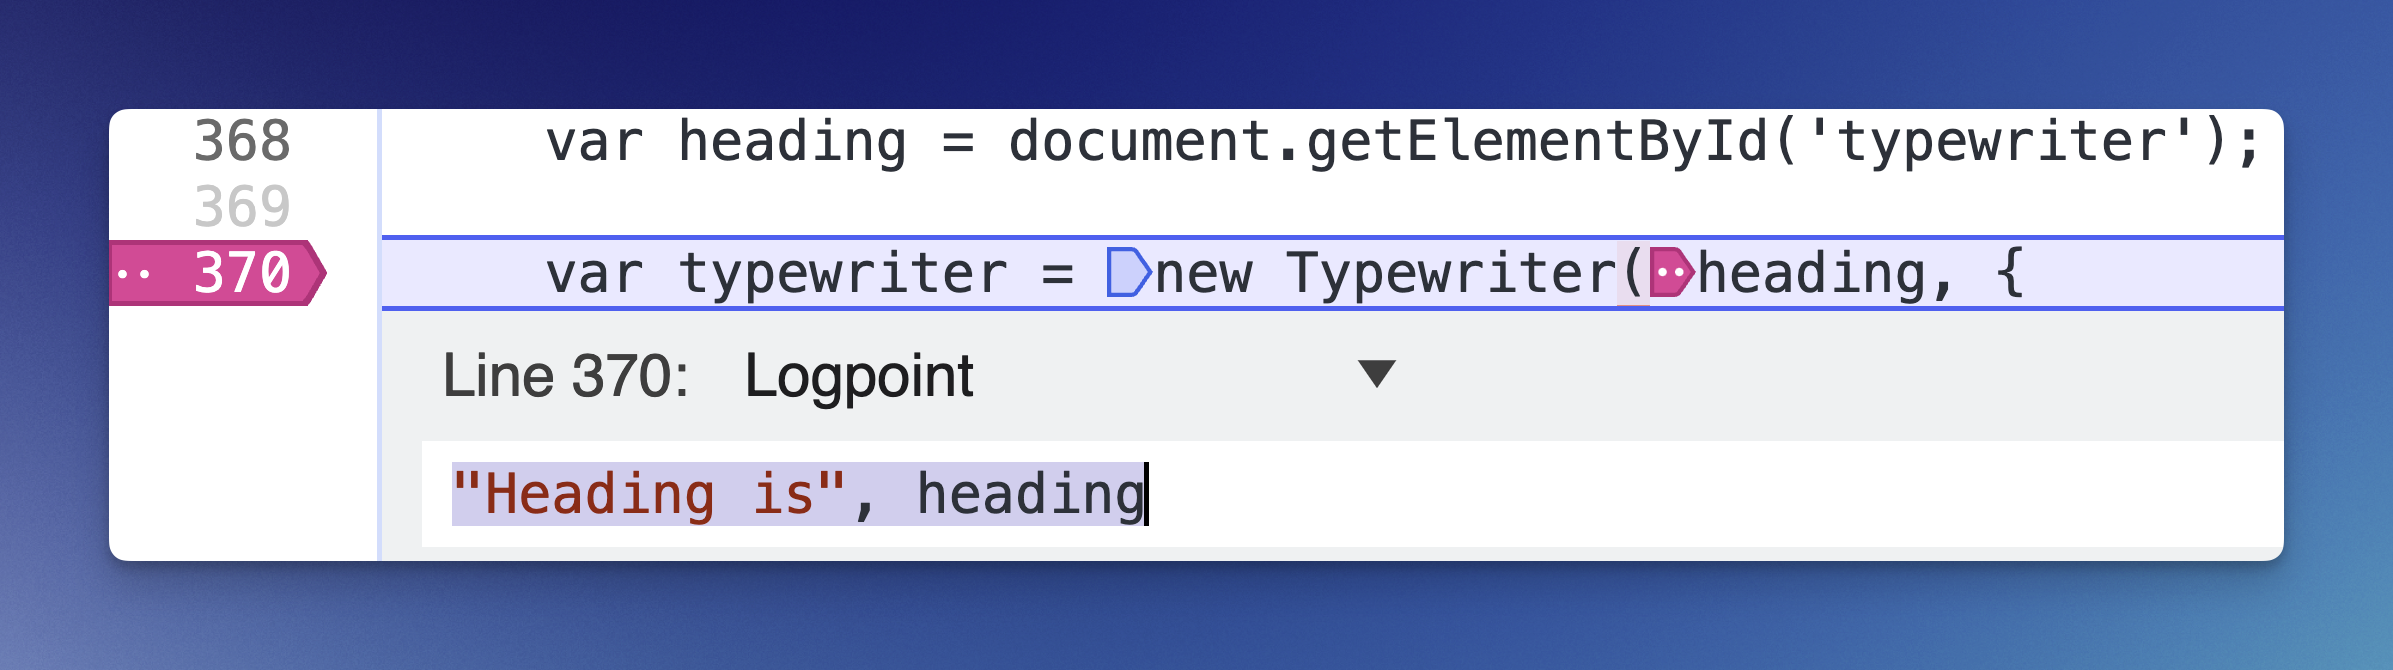
If you don't want to pause the execution but just log something in the console - you can use the log points.
Log points are added the same way as conditional breakpoint. When this line number is executed - there will be a log in the console tab.
Side Tip
debugger; in your code editor and it will pause the execution. You can then add breakpoints within the DevTools. 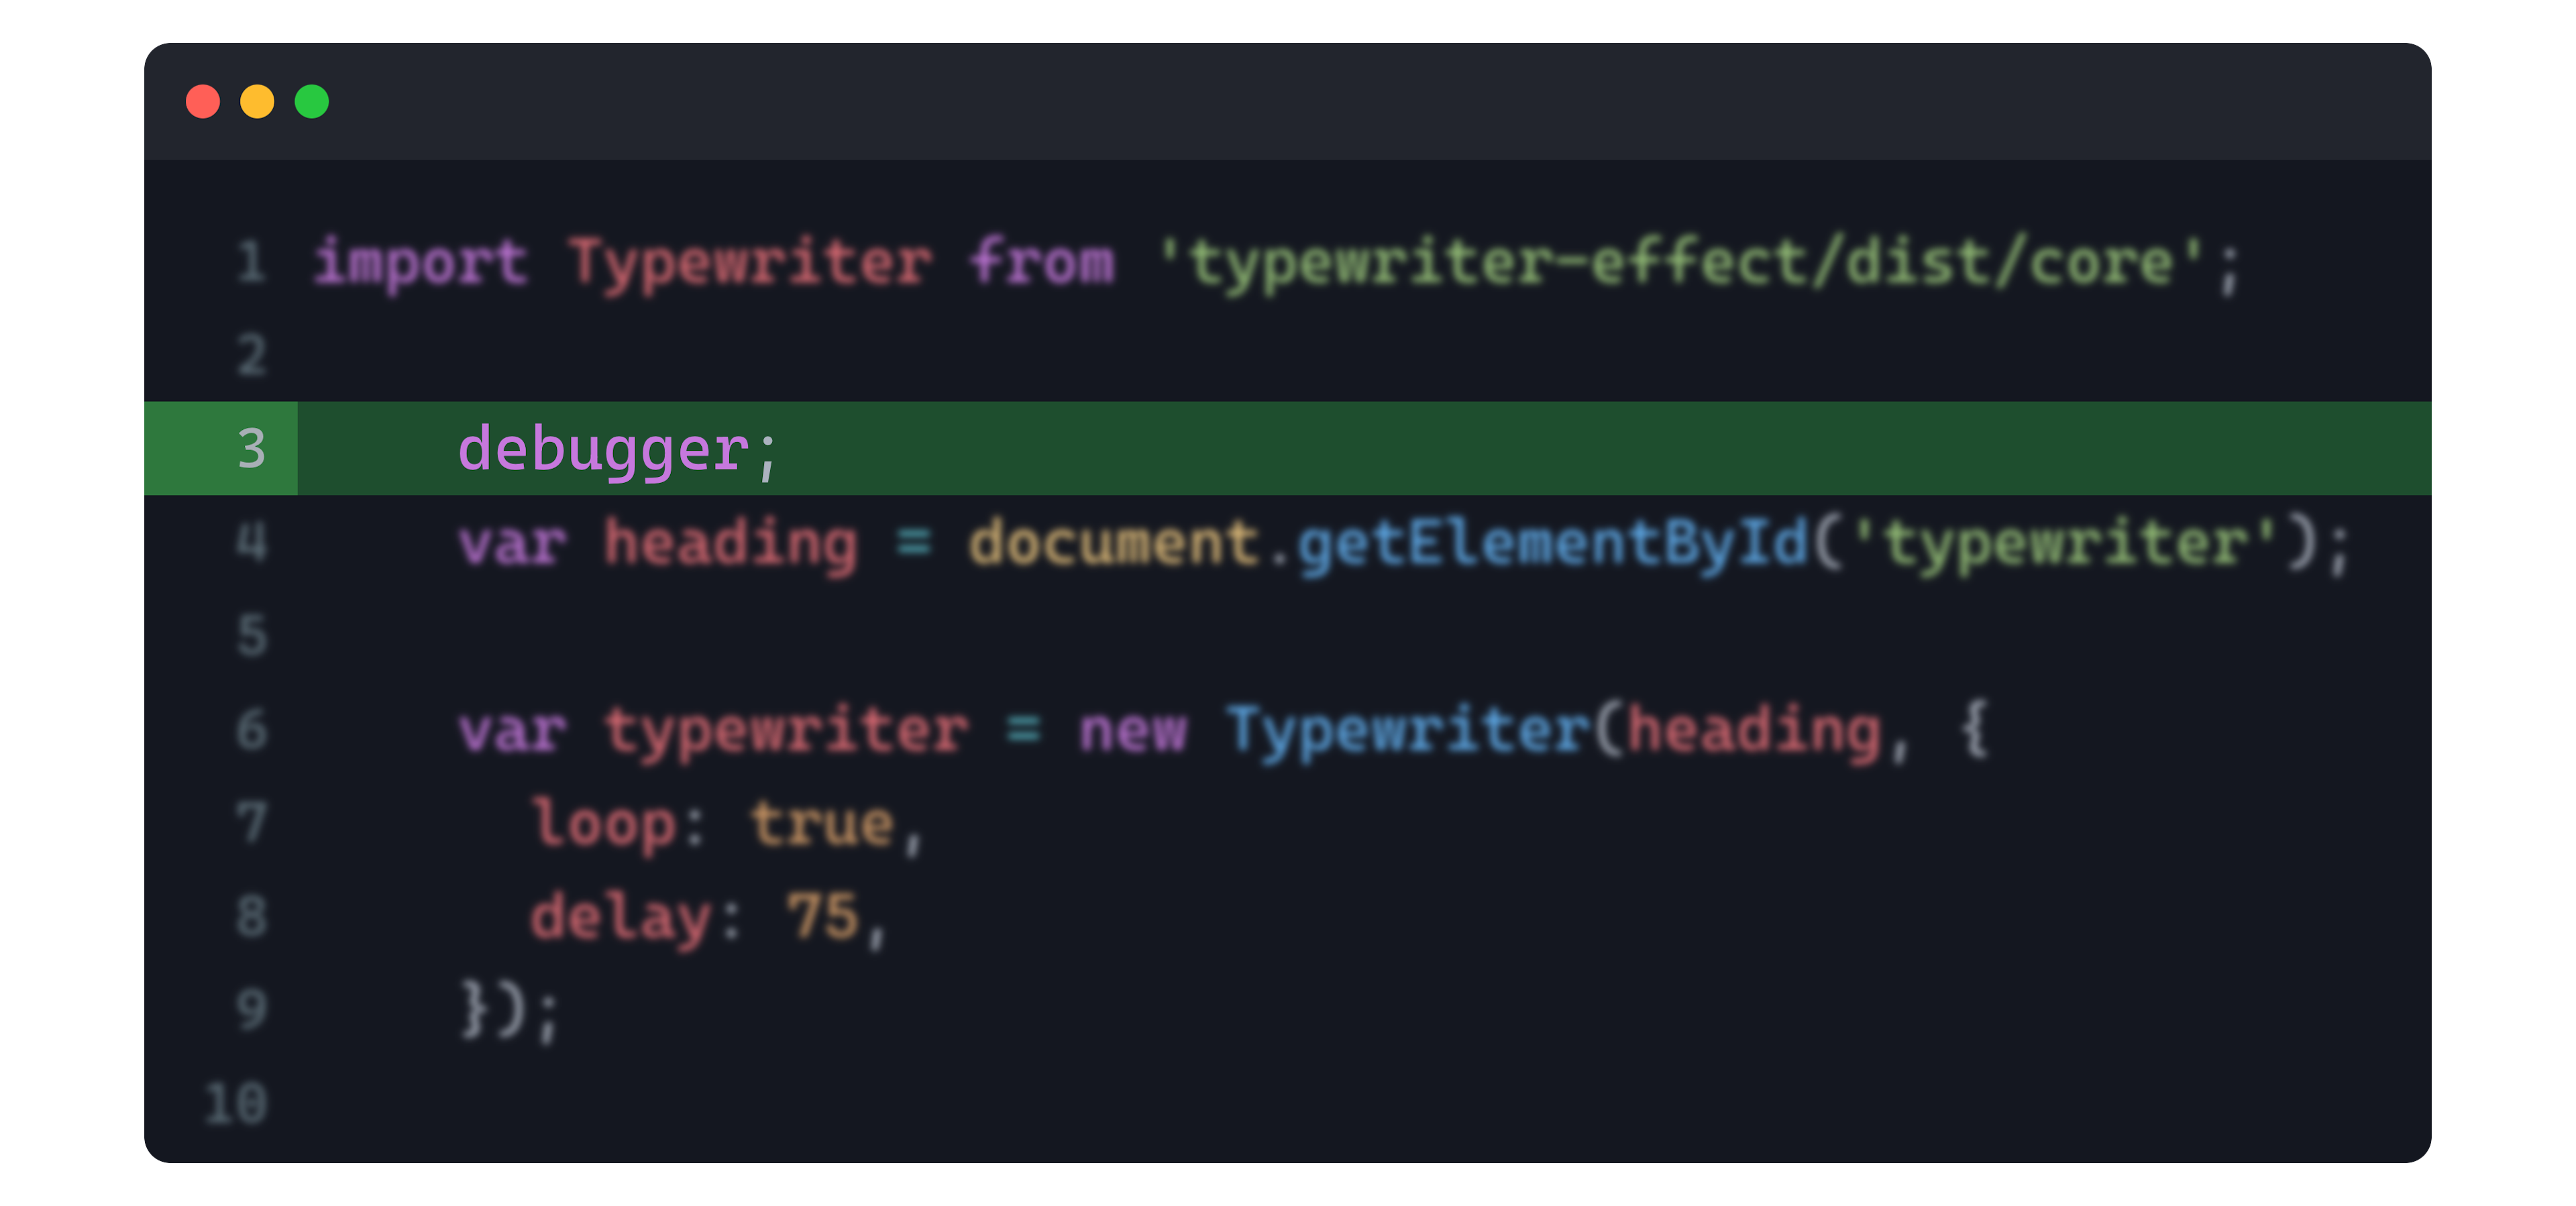
Live Expressions
Maybe you don't want breakpoints, execution pauses or log points but you want to monitor a value all the time. For that - you can use Live Expressions - which helps you to get the value updates in the real time.
To add a live expression, you can open the Console tab and click on the eye button, there you can write your expression.
To type a multi-line expression, start the new line by pressing Shift+Enter.
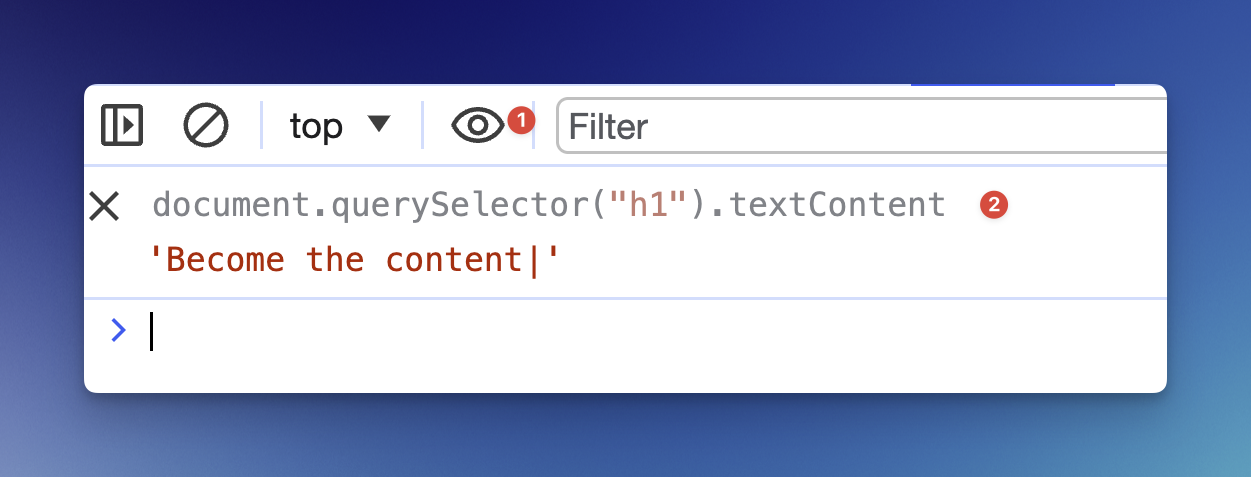
Let me ask you a question here - have you ever thought if there is a shortcut for the long document.querySelector()? Good news, yes there is.
Shorthands
Shorthands are quite useful, so let's also discuss few of the console shorthands that can help you in terms of productivity.
Take the following code:
document.querySelector("h1").textContent;
This can be rewrite the following way:
$('h1').textContent
Another quite useful shorthand is $_, take a look at this example:
TODO: Add image
The $_ symbol stores the last value printed on the DevTools Console. You can also use this symbol to store values in a variable, try the following code in console:
2 + 2
var newValue = $_ + 5
newValue
Executing it all at once will result in NaN. You need to execute each line one by one.
This is all cool but what if you want to debug CSS Properties? Let's talk about that
CSS Debugging
What do you think about the following code? What's wrong with it?
h1 {
  color: unicornpink;
}
What about this one:
h1 {
  top: 20px;
  left: 50px;
}
and this:
.container {
  display: block;
  color: white;
  background: black;
  position: relative;
  justify-content: center;
}
All of these looks correct in terms of syntax but some properties won't work. Debugging them with human eyes is time consuming but if you check them in DevTools - you see the following:
unicornpink: 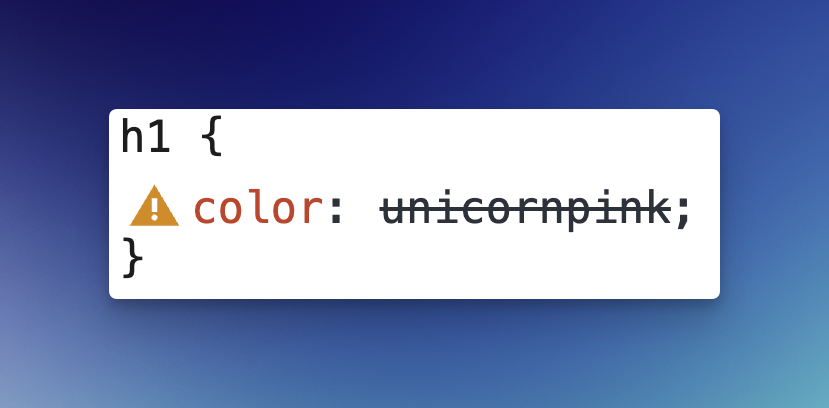 The warning sign means this property or value is not supported.
 This means something is missing (we will talk about that).
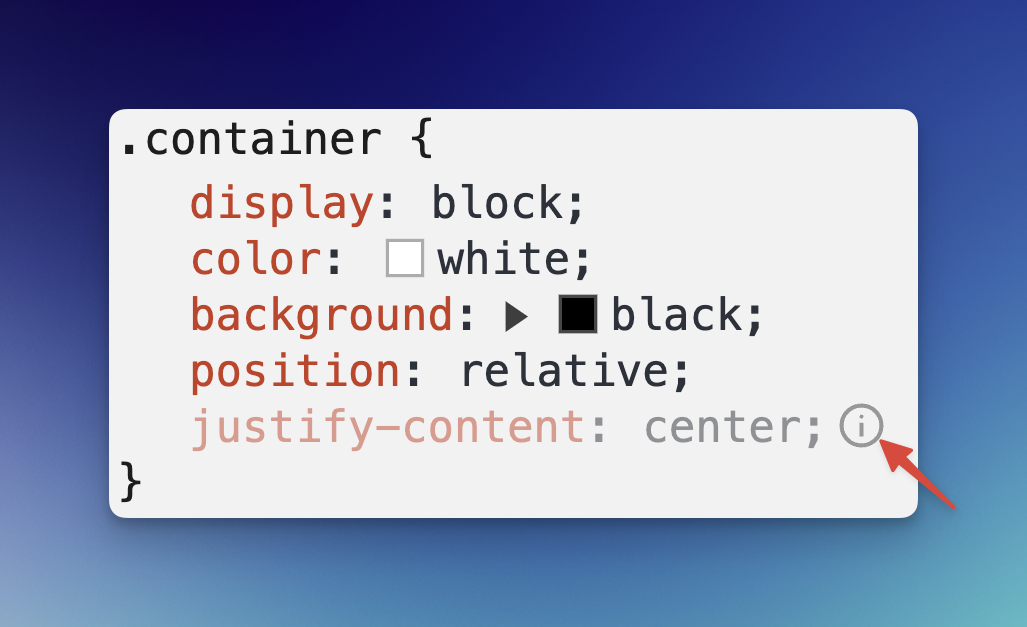 This one also means something is missing - to be clear, a property that must be declared in order to use the one with low opacity. If you hover on the icon (marked in the screenshot), you will see the following message: